One platform, from bare metal to containers.
Cloud servers, VMware-style virtual machines and Docker containers sit side by side - with the networking, storage, managed databases and monitoring to run them in production. One console. One API. One bill in USD.
Fictional company, HQ in Denver, Colorado. Every figure on this page is illustrative - the full console runs right here in your browser.
Illustrative platform figures for this concept demo.
The platform
Seven pillars, one control plane
Each part of Zelvor Cloud is a first-class product in the console - with a guided create flow, live metrics and an audit trail. Explore any of them in the interactive console.
Compute · VPS
Cloud Servers
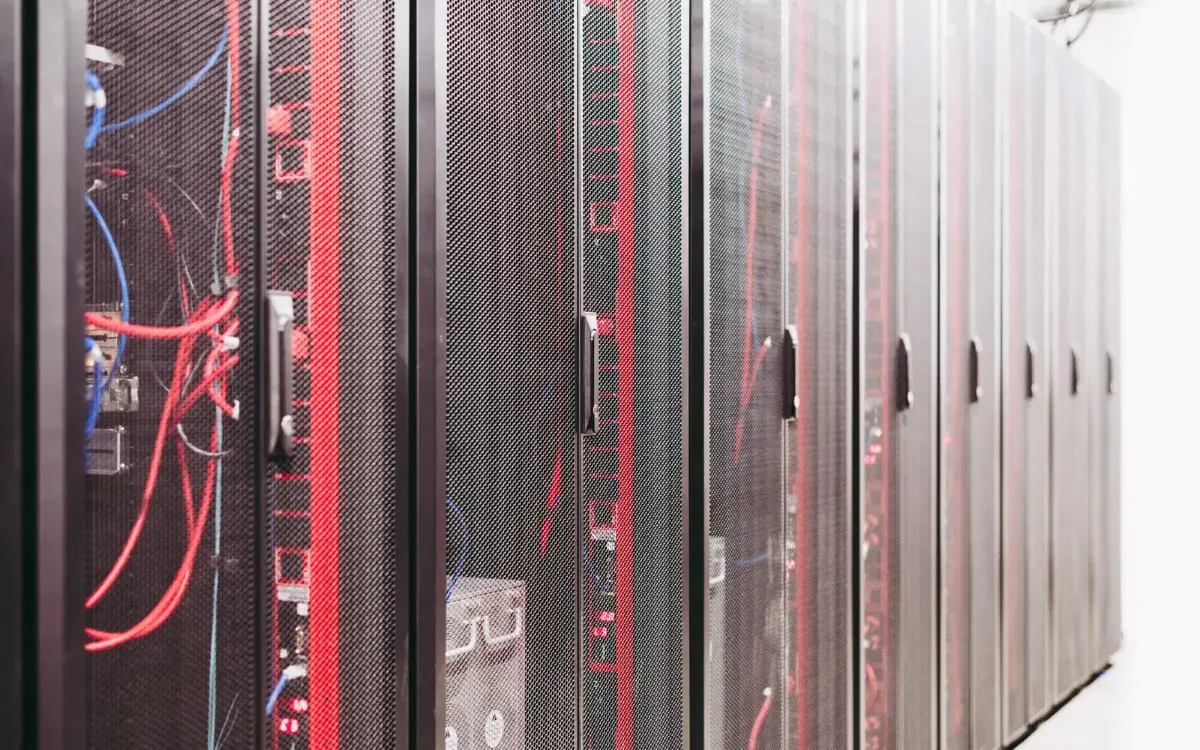
NVMe-backed VPS in eight regions, from a 1 vCPU Nano to a 32 vCPU 2XL. A guided deploy wizard picks a size, image and region, then hands you a real web terminal in about a minute.
- Eight sizes with flat monthly pricing and 1–11 TB of transfer included.
- Snapshots, live resize, optional automated backups and a per-server console.
- Ubuntu, Debian, Rocky, AlmaLinux, Fedora, Windows Server and 1-click apps.

Compute · Virtualization
Virtual Machines
A familiar VMware-style inventory - datacenters, clusters, hosts and datastores in a navigable tree. Right-size CPU and memory, take snapshots and migrate a running VM between hosts.
- Cluster / host / datastore tree with live CPU and memory per host.
- Snapshots, power controls and a vMotion-style live migration between hosts.
- vSAN and NFS datastores with capacity meters and guest-tools status.

Compute · Docker
Docker Containers
Run individual containers or Compose-style stacks, stream logs, exec into a shell and pull images from a private registry - with per-container CPU and memory limits enforced.
- Run, stop and restart containers with port, volume and env configuration.
- Compose-style stacks with a live YAML editor and rolling redeploys.
- Private image registry, log streaming and a shell in every container.

Connectivity
Networking
Managed DNS with record validation, cloud firewalls, load balancers with health checks, private VPCs and reserved IPs - everything you need to wire services together securely.
- DNS zones for A, AAAA, CNAME, MX and TXT records with inline validation.
- Stateful firewalls, VPCs with CIDR ranges and reserved floating IPs.
- Load balancers with round-robin routing, backends and health checks.
Data · Storage
Storage
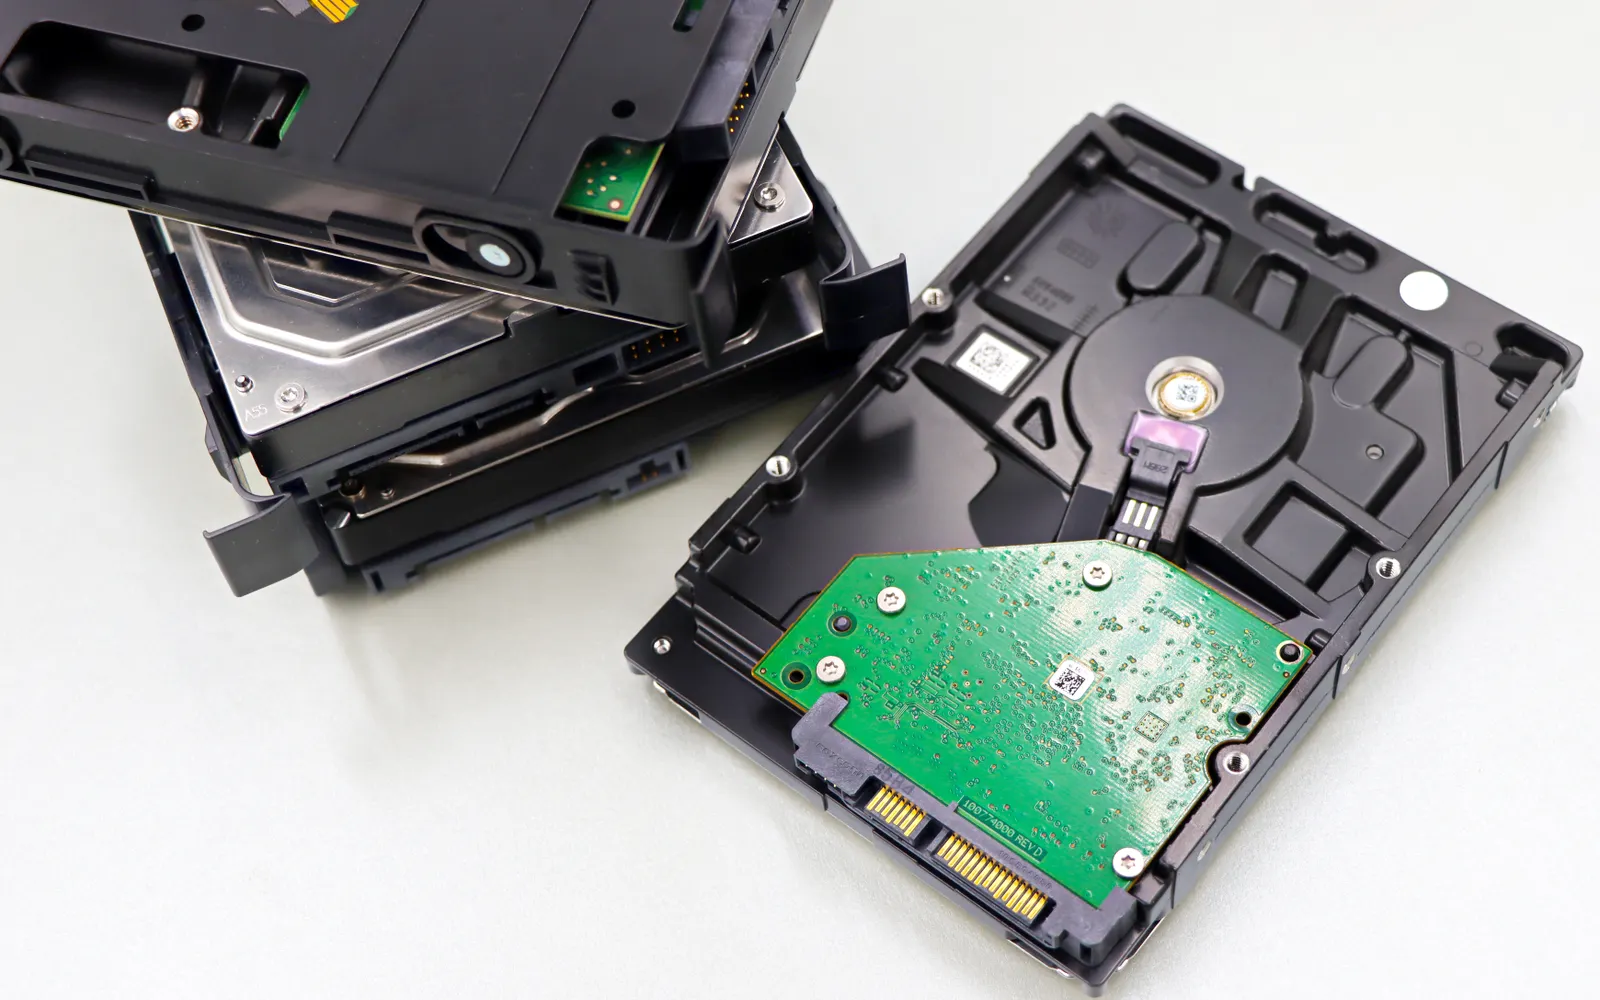
Attach block volumes to servers, keep object storage buckets for assets and backups, and roll back from a snapshot. Capacity and object counts are visible at a glance.
- Block volumes from 25 GB to multiple terabytes, attach and detach live.
- Object storage buckets with public-read or private access controls.
- Point-in-time snapshots of servers and volumes for fast recovery.

Data · Databases
Managed Databases
Provision PostgreSQL, MySQL or Redis with optional high availability and read replicas. Automated backups run for you, and connection strings stay masked until you reveal them.
- PostgreSQL, MySQL and Redis with a guided create flow.
- Optional HA clusters, read replicas and automated backups.
- Masked connection strings, connection metrics and per-database limits.

Operate
Monitoring & Billing
Live metric dashboards across your fleet, alert policies with an incident timeline, and per-resource cost breakdowns that roll up into one predictable monthly invoice in USD.
- Live CPU, memory and disk charts with a fleet-wide overview.
- Threshold-based alert policies and a resolved / open incident timeline.
- Per-resource cost breakdown, invoices and a single monthly bill.
Built in from day one
The details that make it production-ready
Every pillar shares the same platform conveniences - so the console feels like one product, not seven bolted together.
A real web terminal
Open a browser console on any server, VM or container - no SSH client or agent to install.
Command palette
Jump anywhere and run actions from the keyboard - deploy a server, add a record, run a container.
Eight regions
Deploy close to your users across three continents, from Ashburn to Frankfurt to Singapore.
Audit log
Every meaningful change is recorded with who did it and when, visible from the dashboard.
Team & API access
Role-based team members, SSH keys and scoped API tokens for CI and automation.
One bill in USD
Compute, storage, networking and data roll into a single, predictable monthly invoice.
See all seven pillars in action
The full Zelvor Cloud console runs right here in your browser - deploy a server, migrate a VM, run a container, add a DNS record. Nothing to install, no sign-up.
Launch the console →